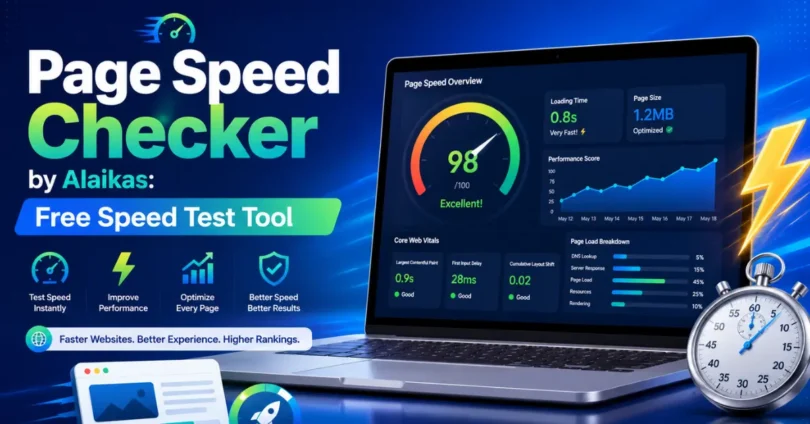

What Is Page Speed Checker by Alaikas?
Page Speed Checker by Alaikas is a free website performance tool built on Google’s Lighthouse and PageSpeed Insights technology. It analyzes any public URL and delivers a detailed report covering:
- Your overall performance score (0–100)
- Core Web Vitals – the metrics Google uses to rank your site
- Specific opportunities to reduce load time
- Diagnostics identifying what’s slowing your pages down
Unlike many speed tools that just give you a number, Alaikas surfaces actionable recommendations written in plain language – so you know exactly what to fix, even without a developer on hand.
Who is it for?
- Bloggers and content creators
- Small business owners
- E-commerce store managers
- SEO professionals
- Web developers and agencies
Why Website Speed Is a Business Problem, Not Just a Tech Problem
Most articles tell you “speed matters.” Few tell you how much it costs you when it’s bad.
Here’s what the data shows:
| Speed Delay | Business Impact |
|---|---|
| +1 second of load time | Conversions drop by up to 7% (Akamai) |
| +2 seconds | Bounce rate increases by 32% (Google) |
| +3 seconds | 53% of mobile users leave (Google) |
| 0.1s improvement | E-commerce revenue increases ~1% (Deloitte) |
Google’s Core Web Vitals update (now part of the Page Experience signal) means slow-loading pages are actively penalized in search rankings – even if your content is excellent.
A slow website signals to Google that you’re delivering a poor user experience. And Google rewards sites that users love.
The bottom line: Speed is not a developer problem. It’s a revenue problem.
What Metrics Does It Measure?
Page Speed Checker by Alaikas measures the six Core Web Vitals and performance metrics that Google cares about most:
Core Web Vitals (Google Ranking Signals)
LCP – Largest Contentful Paint
Measures how long it takes for the largest visible element (hero image, heading, video) to fully load.
- ✅ Good: Under 2.5 seconds
- ⚠️ Needs Improvement: 2.5–4 seconds
- ❌ Poor: Over 4 seconds
INP – Interaction to Next Paint (replaced FID in March 2024)
Measures how quickly your page responds when a user clicks, taps, or types.
- ✅ Good: Under 200ms
- ⚠️ Needs Improvement: 200–500ms
- ❌ Poor: Over 500ms
CLS – Cumulative Layout Shift
Measures visual stability. A high CLS means elements jump around as the page loads – buttons move, text shifts, users click the wrong thing.
- ✅ Good: Under 0.1
- ⚠️ Needs Improvement: 0.1–0.25
- ❌ Poor: Over 0.25
Additional Performance Metrics
| Metric | What It Measures | Good Threshold |
|---|---|---|
| FCP (First Contentful Paint) | Time until the first text or image appears | Under 1.8s |
| TBT (Total Blocking Time) | Total time the main thread was blocked | Under 200ms |
| TTFB (Time to First Byte) | Server response time | Under 800ms |
| Speed Index | How quickly content visually fills the page | Under 3.4s |
Why this matters: Most competitors only show you a score. Understanding which metric is failing tells you exactly where to focus your energy.
How to Use Page Speed Checker by Alaikas (Step-by-Step)
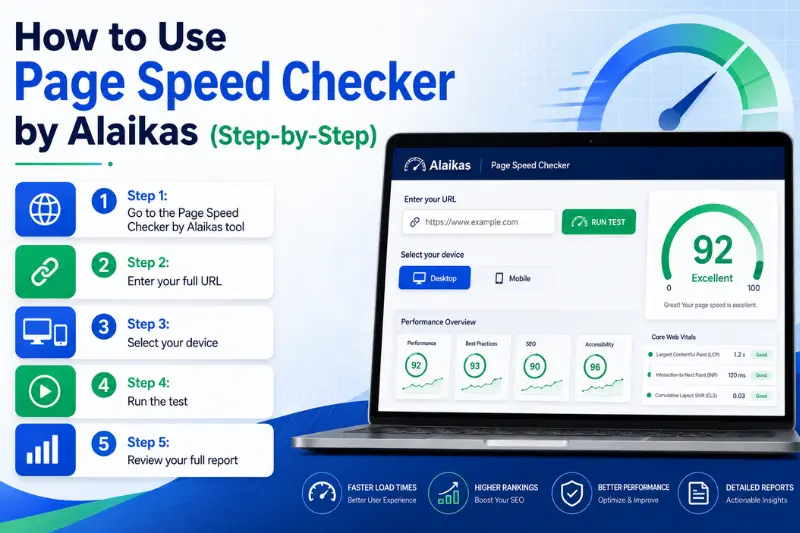
Using the tool takes less than 60 seconds.
Step 1: Go to the Page Speed Checker by Alaikas tool
Navigate to the tool URL and find the speed test input field.
Step 2: Enter your full URL
Type or paste the complete URL you want to test (including https://). Test specific pages, not just your homepage – your product pages, blog posts, and landing pages may have very different scores.
Step 3: Select your device
Choose Mobile or Desktop. Always test mobile first – Google primarily uses mobile for indexing.
Step 4: Run the test
Click “Analyze” or “Test Speed.” The analysis typically takes 15–30 seconds.
Step 5: Review your full report
Your report includes:
- Performance Score (0–100)
- Core Web Vitals pass/fail status
- Opportunities – specific fixes with estimated time savings
- Diagnostics – detailed technical breakdowns
- Passed Audits – what’s already working well
Pro tip: Run the test 2–3 times and take an average. Network conditions affect individual results (more on score volatility below).
How to Read Your Results
Performance Score Ranges
| Score | Rating | What It Means |
|---|---|---|
| 90–100 | 🟢 Good | Fast. You’re in great shape. |
| 50–89 | 🟡 Needs Improvement | Fixable issues that are hurting your rankings. |
| 0–49 | 🔴 Poor | Significant problems affecting users and SEO. |
The Three Result Categories
Opportunities
These are the highest-impact fixes. Each one shows an estimated time saving (e.g., “Reduce unused JavaScript – potential saving: 1.2s”). Start here.
Diagnostics
Technical issues that affect performance but don’t have a direct time estimate. These include things like missing alt attributes, oversized DOM trees, and unminified CSS.
Passed Audits
Everything your site is already doing right. Don’t ignore this section – it confirms what you shouldn’t break when making changes.
Lab Data vs. Field Data: The Difference Most Tools Don’t Explain
This is one of the most misunderstood aspects of page speed testing – and most competitors skip it entirely.
Lab Data (what most speed tests show you)
Simulated results from a controlled environment using a specific device, network speed, and location. Consistent and reproducible, but doesn’t reflect real-world conditions.
Field Data (Chrome User Experience Report / CrUX)
Actual performance data collected from real Chrome users who visited your site in the past 28 days. This is what Google uses in its ranking algorithm.
Why this matters for you:
- Your lab score might be 80, but your field data CLS could be “Poor” – because real users on older phones experience layout shifts your test environment doesn’t simulate.
- If your site doesn’t have enough traffic, field data won’t be available. In that case, lab data is your only benchmark.
- Google ranks based on field data, not lab data. If they differ, trust the field data as a more accurate picture of user experience.
What to do: Always check both. If your lab score looks good but Core Web Vitals show “Needs Improvement” in field data, focus on real-world fixes like optimizing for slower mobile devices and variable network speeds.
What’s a Good PageSpeed Score? (By Industry)
Here’s something competitors almost never tell you: a “good” score depends on your industry and page type.
An e-commerce product page with 40 high-res images will almost always score lower than a simple blog post. That doesn’t mean the product page is broken – it means you need to compare yourself to your actual competitors, not an abstract target.
Typical real-world score ranges by site type:
| Site Type | Average Mobile Score | Target Score |
|---|---|---|
| News / Blog | 60–80 | 80+ |
| E-Commerce (product page) | 30–55 | 55+ |
| SaaS / Software | 50–70 | 70+ |
| Portfolio / Brochure site | 70–90 | 85+ |
| Landing page (no dynamic content) | 75–95 | 90+ |
The smarter benchmark: Run Page Speed Checker by Alaikas on your top 3 competitors’ pages for the same keyword. If your score is higher than all three, you have a competitive speed advantage. If it’s lower, you know exactly where you’re losing ground.
Why Your Score Changes Every Time You Test
If you’ve tested your site and gotten different scores on different runs, you’re not imagining it. Score volatility is real – and here’s why it happens:
- Network variability: The test simulates a mobile network, but actual conditions fluctuate run to run.
- Server load: If your server is under heavier load at the time of the test, TTFB rises and your score drops.
- Third-party scripts: Ad networks, chat widgets, and analytics tools load unpredictably. One test might catch a slow ad auction; another misses it.
- CDN cache state: A page that just had its cache cleared will score lower than a fully cached version.
- Time of day: Server load, CDN performance, and ad network response times all vary throughout the day.
Best practice: Run three tests at different times, then focus on the consistent patterns – not the outliers. If LCP is always flagged, that’s your real problem. If it’s only poor on one of three runs, prioritize other issues first.
Top 10 Fixes to Improve Your Page Speed Score
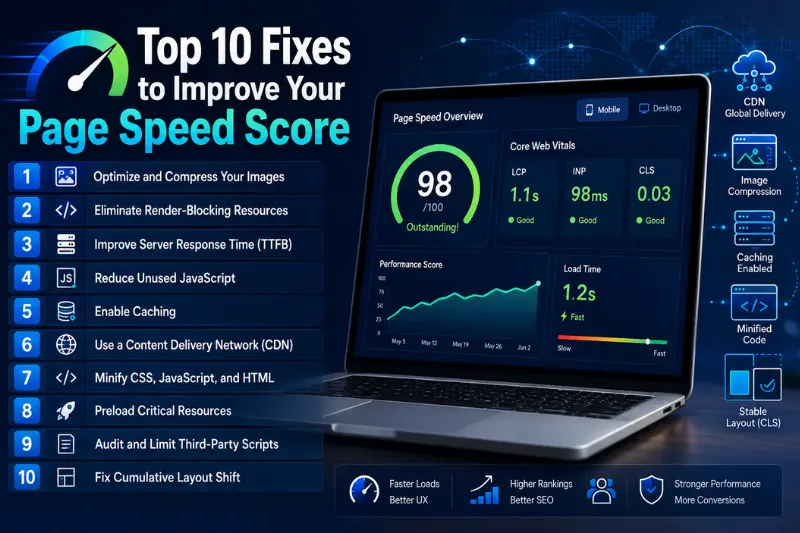
Fix 1: Optimize and Compress Your Images
Images are the #1 cause of slow pages. Before uploading:
- Convert to WebP format (30–50% smaller than JPEG/PNG)
- Compress using tools like Squoosh or ShortPixel
- Add
widthandheightattributes to every<img>tag to prevent CLS - Use lazy loading (
loading="lazy") for images below the fold
Estimated impact: 1–3 seconds of improvement.
Fix 2: Eliminate Render-Blocking Resources
JavaScript and CSS loaded in your <head> block the browser from displaying anything until they finish.
- Add
deferorasyncto non-critical scripts - Move non-critical CSS to load after the page renders
- Inline critical CSS directly in the
<head>
Fix 3: Improve Server Response Time (TTFB)
If your TTFB is over 800ms, your hosting is likely the culprit.
- Upgrade to a faster hosting provider or plan
- Enable server-side caching (Redis, Memcached)
- Use a CDN (Cloudflare, Fastly, BunnyCDN) to serve content from servers closer to your users
Fix 4: Reduce Unused JavaScript
Modern websites often load entire JavaScript libraries when only a fraction is used.
- Remove or defer unused scripts (check the “Coverage” tab in Chrome DevTools)
- Replace heavy libraries (Moment.js, jQuery) with lighter alternatives
- Enable tree shaking in your build tool
Fix 5: Enable Caching
Proper caching means returning visitors load your site from their browser – not your server.
- Set
Cache-Controlheaders for static assets (images, CSS, JS) - Aim for cache lifetimes of 1 year for versioned assets
- Use a caching plugin if you’re on WordPress (W3 Total Cache, WP Rocket)
Fix 6: Use a Content Delivery Network (CDN)
A CDN stores copies of your site on servers around the world. A visitor in Tokyo gets your content from a Tokyo server – not yours in Chicago.
- Free options: Cloudflare (free tier is excellent for most sites)
- Premium options: Fastly, AWS CloudFront, BunnyCDN
Fix 7: Minify CSS, JavaScript, and HTML
Minification removes whitespace, comments, and redundant code – reducing file sizes by 15–30%.
- WordPress: Enable minification in WP Rocket, NitroPack, or Autoptimize
- Custom sites: Use tools like Terser (JS), cssnano (CSS), and HTMLMinifier
Fix 8: Preload Critical Resources
Tell the browser to download your most important assets first.
- Use
<link rel="preload">for your hero image, primary font, and critical CSS - Use
<link rel="preconnect">for third-party domains you’ll definitely use (Google Fonts, analytics, etc.)
Fix 9: Audit and Limit Third-Party Scripts
Every third-party script – chat widgets, ad pixels, heatmaps, social share buttons – adds network requests and blocks rendering.
- Audit all third-party tags using Google Tag Manager
- Remove anything you don’t actively need
- Load non-critical scripts after the page becomes interactive
Estimated impact: This single fix can save 500ms–2 seconds, especially on pages with many ad tags.
Fix 10: Fix Cumulative Layout Shift
CLS is often caused by elements that load after the page is partially rendered.
- Always specify
widthandheighton images and video embeds - Reserve space for ads and embeds before they load
- Avoid injecting content above existing content after page load
How to Prioritize Fixes When You Have Limited Resources
If you can’t fix everything at once, use this priority matrix:
| Priority | Fix | Effort | Impact |
|---|---|---|---|
| 🔥 Do first | Compress images to WebP | Low | High |
| 🔥 Do first | Add a CDN (Cloudflare free) | Low | High |
| 🔥 Do first | Enable caching | Low | High |
| ⚡ Do next | Defer render-blocking scripts | Medium | High |
| ⚡ Do next | Reduce unused JavaScript | Medium | High |
| ⚡ Do next | Fix CLS (set image dimensions) | Medium | Medium |
| 📅 Schedule | Upgrade hosting | High | High |
| 📅 Schedule | Rebuild with performance-first framework | Very high | Very high |
Always start with the “Opportunities” section of your Page Speed Checker by Alaikas report. Those are pre-sorted by estimated time savings – the biggest wins are listed first.
How Page Speed Affects Your Google Ranking
Google confirmed page speed as a ranking factor for desktop in 2010 and for mobile in 2018. Since then, three developments have made it more critical than ever:
1. Core Web Vitals became official ranking signals in May 2021
LCP, CLS, and FID (now INP) directly influence where your page appears in search results. Pages that pass Core Web Vitals can get a ranking boost over comparable pages that don’t.
2. Mobile-First Indexing is now universal
Google indexes and ranks your site based on its mobile version. A desktop score of 90 with a mobile score of 40 is a problem – the 40 is what matters.
3. Page Experience signals compound with content quality
Google doesn’t reward fast but thin content. But between two pages of similar quality, the faster page wins. Speed is the tiebreaker – and increasingly, the differentiator.
What to monitor in Google Search Console:
- Core Web Vitals report – shows which URLs are “Poor,” “Needs Improvement,” or “Good”
- Page Experience report – shows your overall experience score
- Validate fixes directly in Search Console after you’ve made improvements
Common Misconceptions About Page Speed Scores
Misconception 1: “I need a score of 100 to rank well.”
False. A score of 90+ is excellent. Pushing from 95 to 100 often requires tradeoffs (removing useful features, limiting personalization) that aren’t worth the marginal gain.
Misconception 2: “My homepage score applies to all my pages.”
Wrong. Every page has its own score. A lightweight homepage might score 90 while a feature-heavy product page scores 45. Test your most important pages individually.
Misconception 3: “A higher score always means a better user experience.”
Not necessarily. Some speed improvements only help in the test environment. Focus on field data (real user experience) alongside lab scores.
Misconception 4: “Fixing speed once is enough.”
No. Every plugin you add, every new image you upload, and every third-party script you install can degrade your score over time. Build a habit of testing monthly.
Misconception 5: “My competitor’s score is lower than mine, so I’m fine.”
Maybe. But if both of you score under 50 on mobile, you’re both losing users and rankings. Use your competitor’s score as a floor, not a ceiling.
Frequently Asked Questions
Is Page Speed Checker by Alaikas free?
Yes. The tool is completely free to use with no sign-up required.
How often should I test my website speed?
Test after any significant change to your site (new theme, plugin, images, major content updates). As a baseline routine, run a monthly speed audit.
Why is my mobile score so much lower than my desktop score?
The mobile test uses a simulated slower device (mid-range Android) and a throttled 4G connection. This reflects real-world conditions for a large portion of your audience. A gap of 20–30 points between mobile and desktop is normal – anything wider needs attention.
Does improving my PageSpeed score automatically improve my Google ranking?
Not directly or immediately. Speed is one of many ranking factors. However, passing Core Web Vitals can give you an edge over competitors with similar content quality, and better speed reduces bounce rate – which signals quality to Google indirectly.
What’s the difference between PageSpeed Insights and Page Speed Checker by Alaikas?
Page Speed Checker by Alaikas uses the same underlying Lighthouse engine as Google’s PageSpeed Insights but presents results in a more user-friendly format with clearer fix recommendations – making it faster to act on results without a technical background.
Can my hosting provider affect my score?
Yes, significantly. Shared hosting with slow TTFB can single-handedly drag your performance score down. Upgrading to managed WordPress hosting, VPS, or using a CDN can produce dramatic improvements without any code changes.
Will installing a caching plugin fix all my speed issues?
A caching plugin helps – often significantly – but it won’t fix everything. Images still need compression, JavaScript still needs auditing, and server response times still depend on your hosting. Think of caching as the first layer, not the whole solution.